Other Metrics
Campus Building Footprint | University Floor Space | Sustainable Practices
Campus Building Footprint (m²)
A campus building footprint refers to the area of land that a building occupies on a campus. It is typically measured in square feet or square meters and outlines the perimeter of the building at ground level.
For SY 2024-25 the University’s building footprint is 133,887 m².
University Floor Space (m²)
Floor space refers to the total area of a building's floor, measured in square units (like square feet or square meters). It includes all usable areas within the walls of the structure, typically excluding vertical space, like ceilings or walls.
As of August 2024 of this School Year (2024-25), the total University floor space is measured as 335,396 m².
Return to Top
Sustainable Practices
Bicycles on Campus | EJeep: Passenger Volume | Pedestrians | Vehicles | School Buses | Electric Vehicles
Sustainable Practices in Campus Mobility (SY 2023-2024 To SY 2024-25)
Ateneo de Manila University is committed to promoting sustainable commuting by monitoring mobility data and providing infrastructure that reduces carbon emissions. Key initiatives include paved walkways, cycling routes, electric jeepneys (E-jeeps), school bus services, carpooling, and a tricycle station. Tracking data across two school years shows how these practices continue to expand.
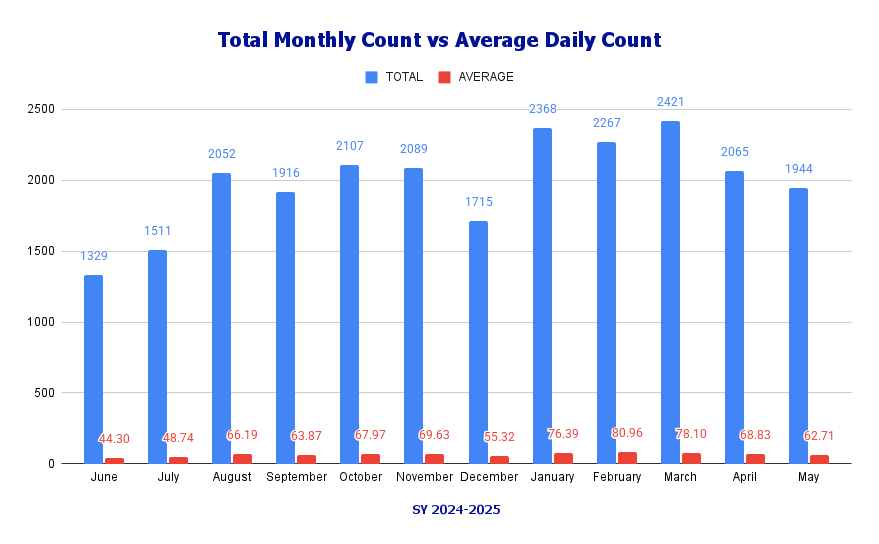
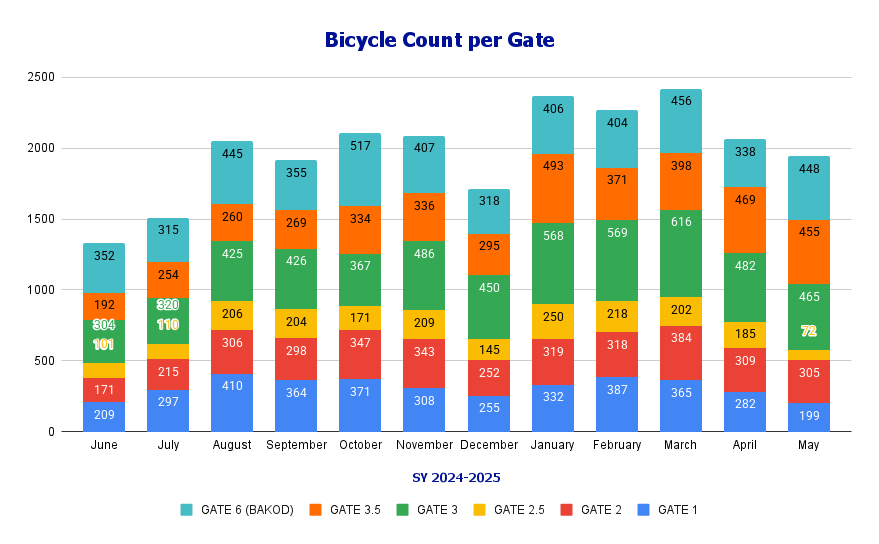
Bicycles on Campus
In SY 2023–2024, bike counts reflected a growing interest in cycling as a commuting option. By SY 2024–2025, both daily and monthly counts increased further, showing steady uptake in bicycle use across campus gates.
Return to Sustainable Practices | Return to Top
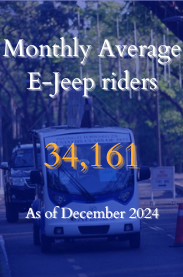
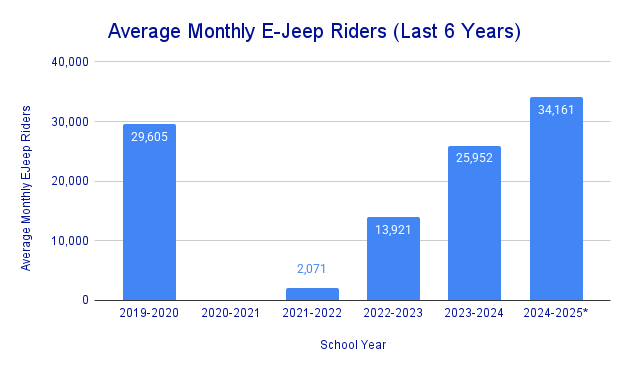
E-Jeep Shuttle Service
The five E-jeeps resumed service after the pandemic and recorded consistent ridership in SY 2023–2024. In SY 2024–2025, passenger volume rose significantly, signaling stronger reliance on this low-emission transport option.
Return to Sustainable Practices | Return to Top
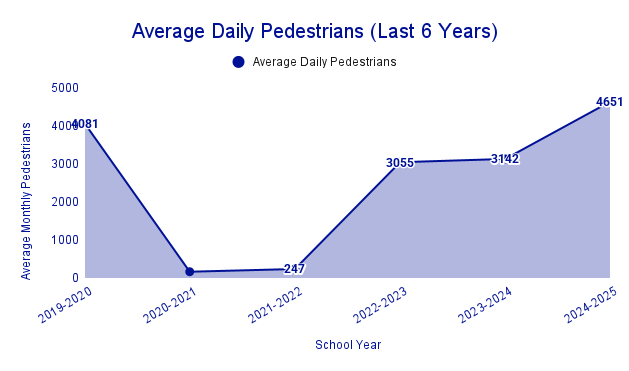
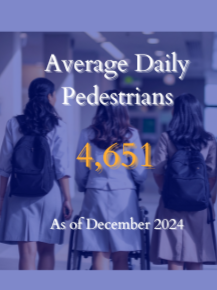
Pedestrian Traffic
Walking remains central to Ateneo’s people-centric mobility. In SY 2023–2024, pedestrian entries rebounded after COVID-19 restrictions. By SY 2024–2025, daily averages stabilized at higher levels, supported by an expanded network of covered walkways and paths.
Return to Sustainable Practices | Return to Top
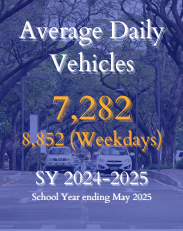
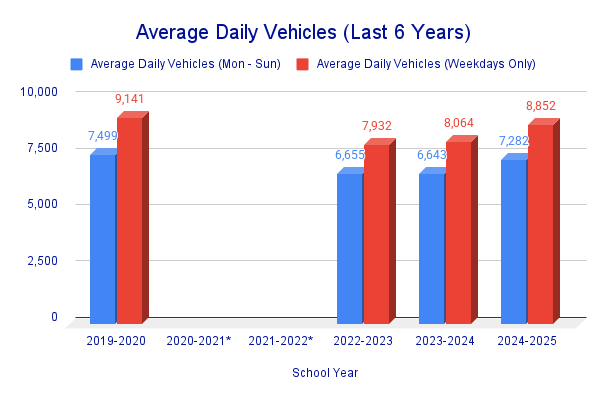
Vehicle Entries
Average daily vehicle entries were moderate in SY 2023–2024 as campus activity normalized. In SY 2024–2025 counts rose further with the inclusion of new monitoring gates, giving a more complete picture of on-campus traffic.
Return to Sustainable Practices | Return to Top
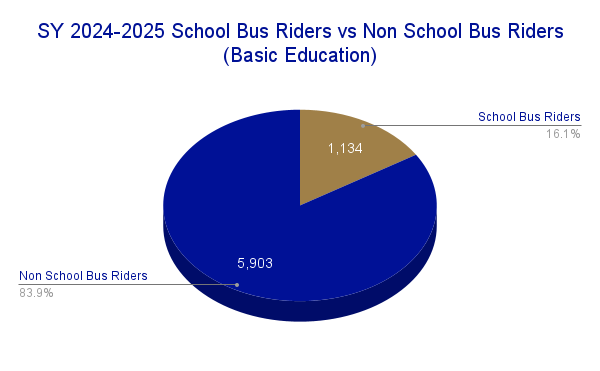
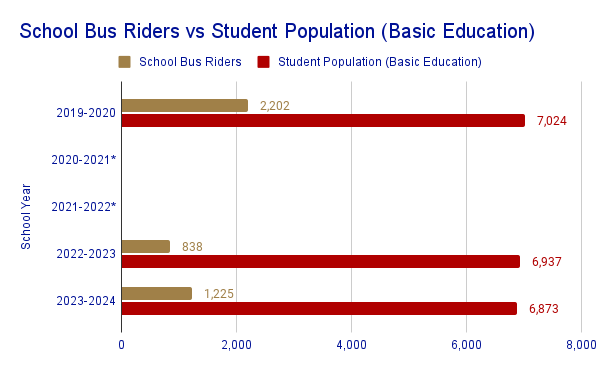
School Bus Service
Basic Education data of the number of school bus riders.
Return to Sustainable Practices | Return to Top
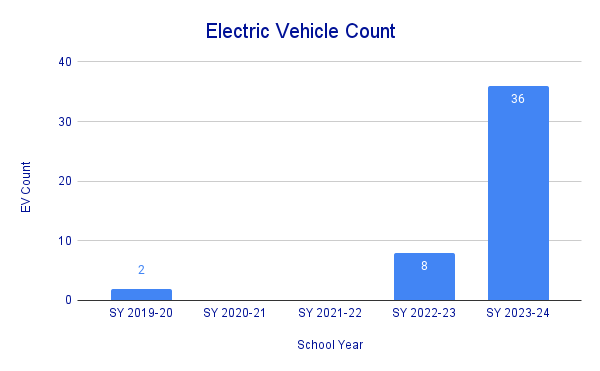
Electric Vehicles
Number of electric vehicles registered with the University.
Return to Sustainable Practices | Return to Top
Sources:
Ateneo Institute of Sustainability
Office of the Vice President for Administration
Central Facilities Management Office
Campus Safety and Mobility Office
Office of Food Safety and Quality Assurance
Strategy and Quality Management Office